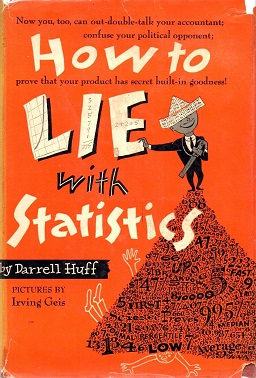
Publisher: W. W. Norton & Company
Originally published on: 1954
Number of pages: 144
How to Lie with Statistics

‘How to Lie with Statistics’ was published in 1954, in all its essences it’s quite an old book. So what made a 20 something year old man into to read a book published before he was born?
A while ago I was asked to generate statistics for a software that I built. I immediately went straight into the task! Although it worked like a charm, it didn’t represent the true purpose related to the spirit of the software. Henceforth it led me to a journey of ‘How to Lie with Statistics’.
I’ve been a huge fan of small books for a few years. How to Lie with Statistics is a type of book that doesn’t require its readers to have mathematical talents. Although it’s old it is not quite outdated, it’s teachings is so intriguing that it kept me reading. Reading a 60 year old book can be very refreshing, the book on public representation and marketing is quite relevant today.
I was attracted to the book’s title from the list of recommended books by the Wall street Journal. Most examples were based on social and economics values in 1954 but it’s insight is still fresh for modern times, especially when you think of our current climate in social media and politicians.
I can tell that many statisticians use information represented in this book all the time! The techniques described by the author are simple, and any professional should see through them. With statistics being presented around every corner in today’s society, some help maybe needed to decipher which statistics are truly suitable.
The main purpose of this book is to show that even though the statistics analysed is true, it can misrepresent some or many information and it would try to help you find sense in those false pulses. There are many errors in representations in books, newspapers, websites and other stuffs, and this book tries to illustrate them.
The author describes statistics as “employed to sensationalize, inflate, confuse, and oversimplify”. He tries to portray intentional and unintentional mistakes, made by people while using statistics representations. In this book the authors brings up a lot of graphs and charts, samples and a lot more to show how statistics can be misrepresented. He not only explains these different aspects of statistics in detail, but also reveals the importance of being able to differentiate between a legitimate fact and an imprecise statistic.
One of the strongest aspects of this book is the detailed illustrations. For example when he talks about the one-dimensional picture he not only explains what a one-dimensional picture is, but has illustrations to offer further understanding. Since a great deal of statistics is portrayed through illustrations, such as graphs, it is important that books about statistics include such illustrations. Imagine trying to understand the depiction of a graph through a verbal explanation. I believe it would be more difficult than simply looking at a graph.
It took about 4 days to read just a dedication of about 1 hour a day to read can change your professional (or even personal!) life. After all, I think it would be enjoyable to read this book.